Pushing drug discovery forward with data-driven purification
In the world of drug development, the purification process is an essential step to ensure the success of downstream applications, from chemical synthesis to ADMET studies and in-vitro/vivo assays. High-Performance Liquid Chromatography (HPLC) stands out, known for its flexibility in handling a wide range of chemical compounds and mixtures. At Sygnature, we view chromatography as a rich data source.
This level of efficiency and quality, especially when dealing with over 2000 samples monthly, poses a significant challenge: how do we consistently deliver high-quality results with such high throughput? The answer is in integrating chromatographic data into an automated workflow that guarantees consistent and correct conditions. This article looks at how our purification process has changed and improved thanks to data and smart strategies.
Streamlining the Purification Workflow
Our purification process begins when chemists submit their samples to our submission system. Samples are then grouped into batches, dissolved and screened using two different analytical conditions to identify the most efficient purification method. As illustrated in Figure 1, the aim is to have impurities resolved from the target peak. The fewer impurity peaks around the target, the faster the purification with the higher the chance of success. The data acquisition takes up to 3 hours, but the manual data analysis requires at least 5 hours which takes a lot of analysts’ time.
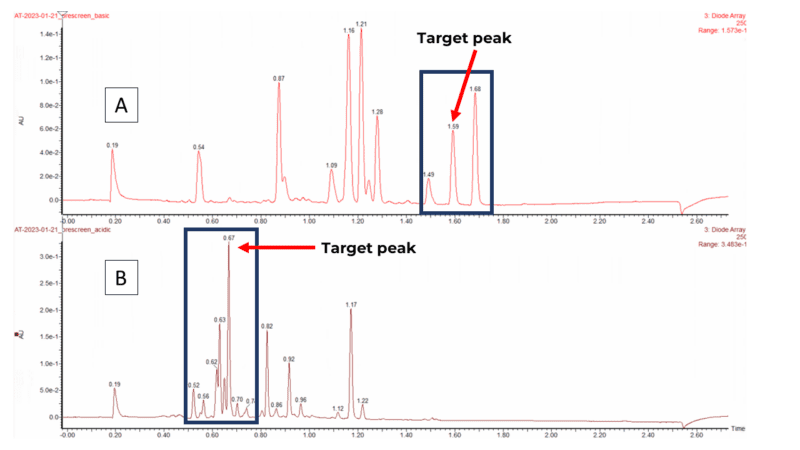
Figure 1: UPLC runs of a generic sample into (a) Basic pH, best condition, few peaks around the target (b) Acid pH, worse condition, many peaks around the target.
This is the most critical and data-heavy step of the process, as several key parameters like target retention time, UV and mass spectrometer signal intensities, peak purity, and particularly the preparative run length are evaluated. Figure 2a shows how we select the run length based on the impurities’ elution and UV signal intensity relative to our target peak within a range of 0.3 minutes around the target. Selected run length and target peak retention time are used to define focused purification gradients by applying scale-up rules (Figure 2b). With the run length defined for both conditions, we will always choose the fastest method.
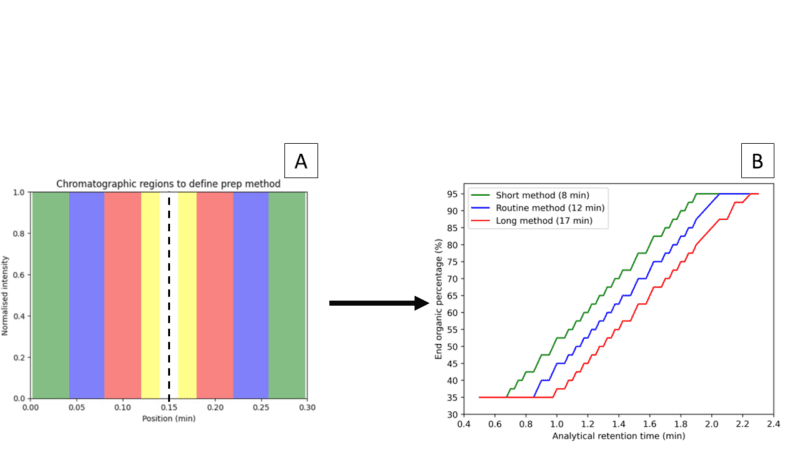
Figure 2: (A) Regions to decide run lengths, the dashed line represents the centred target peak. Yellow: needs bespoke development. Red: Long method (17 minutes). Blue: Routine method (12 minutes). Green: Short method (8 minutes). (B) Scaling-up model to define gradient end organic percentage based on the target peak retention time. The starting percentage is the end percentage minus 30%.
As the number of samples increases, maintaining consistent decision-making and reasonable processing time becomes a challenge that automation could solve.
Automating the Screening with Data and Machine Learning
To streamline the process and drive consistency, we have developed an automated system that combines submission information with acquired raw data from each chromatographic run. The data undergoes pre-processing, including smoothing and baseline correction, to ensure its quality and reliability. The core of our analytical approach involves a mass-directed strategy to accurately identify the target peak. This is followed by defining the integration interval and calculating both the chemical purity of the sample and the peak purity of the target peak, as displayed in Figure 3. These critical steps enable us to gather all the necessary information for optimised purification, such as the presence of coeluting impurities. However, the real challenge is the automation of the complex decision-making process depicted in Figure 2a.
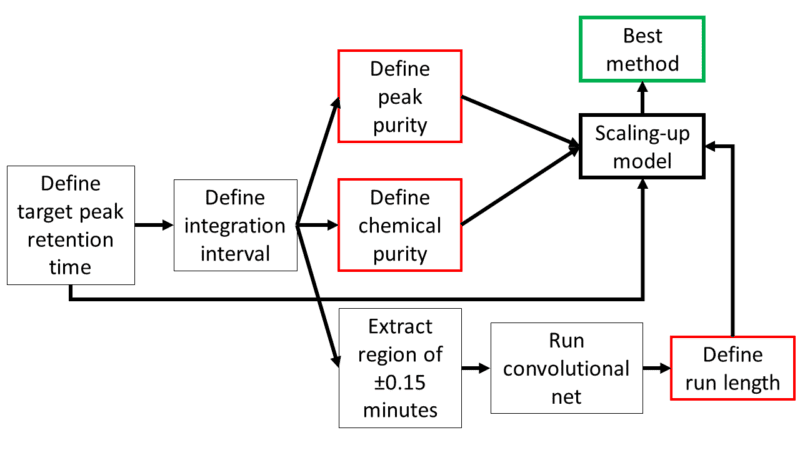
Figure 3: Diagram of the automated method development.
To solve this, we employed computational simulation to generate thousands of hypothetical scenarios, as shown in Figure 4. This approach ensured a comprehensive range of labelled chromatograms, ideal for training machine learning models. The simulated data was then fed into a convolutional neural network (CNN), a type of deep learning model well-known for its pattern recognition capabilities. CNNs, with their multiple filters for detecting edges and shapes, are widely used in applications ranging from speech recognition in smartphones to tumour detection in healthcare. In our case, they can detect different impurity levels to develop optimal chromatographic conditions.
By analysing the specific region of ±0.15 minutes around the target peak (Figure 2a), our CNN algorithm determines the most suitable purification method for each sample, whether it be a short, routine, long, or bespoke method.
The effectiveness of our CNN model is evidenced by correctly classifying 99.5% of chromatographic examples that are not included in the training. The model excels in discerning complex patterns of the relationship between impurity and target peak within the critical window.
The integration of this automated system into our workflow has been transformative. An example of its impact is our capability to process large data batches in less than five minutes compared to five hours. Additionally, it identifies key data points and ensures consistent examination of each sample. The output of this analysis is a simple summary for our analysts, highlighting any samples that may require further attention. This method significantly saves our analysts’ time, allowing them to focus on more complex aspects of the purification process adding greater value to our clients.
Since its implementation in February 2023, 95% accuracy in method selection has been achieved. This level of precision is crucial in our commitment to delivering high-quality, pure chemical compounds.
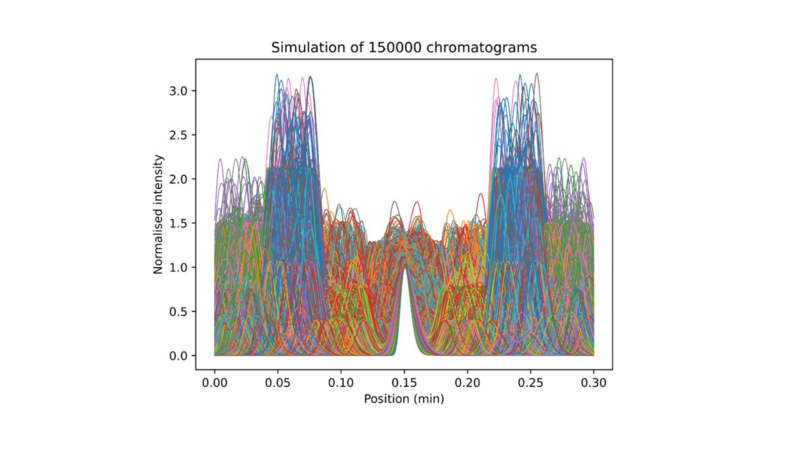
Figure 4: Example of thousands of simulated chromatograms.
Prospects and Continuous Innovation
The integration of data-driven strategies and machine learning into our chromatographic processes represents a fundamental shift in our approach at Sygnature. This paradigm shift has not only streamlined our purification capabilities but has also established new benchmarks in efficiency and precision.
The incorporation of data analytics is a key benefit of this data-driven approach. By tracking every aspect of the process, we gain valuable insights into our operational performance. This level of data integration supports ongoing monitoring and refinement of our methods, ensuring continuous improvement in our purification techniques.
We are now expanding this technology to reduce instrument idle time, seamlessly integrating the analytical and purification steps. This strategy will maximise our instruments’ output and, consequently, our overall purification capacity.
Looking to the future, we anticipate that our data-driven approach will not only sustain our competitiveness but also contribute to wider advancements in the purification field while enabling our chemists to deliver more to our clients.
In conclusion, our growth towards data automation and integration is not only about keeping up with industry advancements. It is about being a reference of efficiency in the field, continuously paving the way for innovative solutions in the purification process.
About the authors
Dr Rodrigo Mancini, Senior Scientist 2
Alex Brien, Separation Science Team Leader
Evelina Gudoityte, Scientist 2