

Featured Resources
-
STORM Therapeutics: From Lead to Pre-Candidate Nomination in 18 Months

STORM Therapeutics: From Lead to Pre-Candidate Nomination in 18 Months
Case study
📣From lead to pre-candidate nomination in 18 months. Explore the STORM Therapeutics case study


Discover precise insights into brain neurochemistry with Sygnature Discovery's in vivo microdialysis and cOFM services. With over 20 years of expertise, we design bespoke studies that reveal how compounds modulate neurotransmitter systems in health and disease. Using UHPLC/HPLC with electrochemical detection or mass spectrometry, we deliver robust PK/PD data to support confident CNS decision making.


July 30, 2015

Inobrodib, an exciting, first-in-class oral anti-cancer drug in clinical development by CellCentric, was collaboratively designed, synthesised and supported on its pre-clinical journey by an integrated project team at Sygnature Discovery. Inobrodib is now showing promising results in Phase I and II trials for multiple myeloma and other cancer types.

At Sygnature Discovery, we deliver world-leading drug discovery solutions to accelerate your compound from idea to clinic.

Our leadership team brings diverse experience and insight, driving collaboration and innovation across drug discovery.

Explore careers at Sygnature Discovery and join a global team committed to science, collaboration, and integrity.
Inobrodib, an exciting, first-in-class oral anti-cancer drug in clinical development by CellCentric, was collaboratively designed, synthesised and supported on its pre-clinical journey by an integrated project team at Sygnature Discovery. Inobrodib is now showing promising results in Phase I and II trials for multiple myeloma and other cancer types.
At Sygnature Discovery, we deliver world-leading drug discovery solutions to accelerate your compound from idea to clinic.
Our leadership team brings diverse experience and insight, driving collaboration and innovation across drug discovery.
Explore careers at Sygnature Discovery and join a global team committed to science, collaboration, and integrity.
TRPML1 screening using automated electrophysiology provides a robust and efficient platform for ion channel drug discovery. Sygnature Discovery leverages this approach to support compound profiling, mechanism of action studies and lead optimization.
Transient Receptor Potential (TRP) channels constitute a vital group of integral membrane proteins that are widely distributed in mammalian cells and tissues. These channels play a crucial role in defining cellular signalling and function through regulation of membrane excitability and mediation of intracellular calcium levels. While TRP channels present promising therapeutic opportunities, the identification of compounds devoid of cross-reactivity with closely related family members remains a significant challenge.
TRPML1, a non-selective cation-permeable channel, is predominantly found on the membranes of late endosomes and lysosomes across mammalian cell types. TRPML1 is pivotal in maintaining lysosomal calcium homeostasis, modulating autophagy, and influencing oxidative stress. Mutations in TRPML1 have been implicated in various conditions, including lysosomal storage disorders and neurodegenerative diseases such as Alzheimer’s and Parkinson’s disease. Correcting aberrant TRPML1 activity has been suggested as a potential strategy to rectify abnormal autophagy and help clear protein/ROS accumulation in affected cells.
Despite some success in modulating TRPML1 with synthetic compounds, the lack of specific pharmacological tools has hampered a deeper understanding of TRPML1’s role in normal lysosomal function and its association with pathological processes.
Sygnature Discovery’s comprehensive TRP channel discovery platform includes meticulously optimized TRP channel cell lines, including TRPML1, TRPML2, and TRPML3, coupled with robust assays designed to support your drug discovery research. Leveraging both 384/1536-well fluorescence-based and electrophysiology platforms for high-throughput screening and lead optimization, Sygnature Discovery enables rapid hit identification and downstream discovery cascades.
HEK cells stably expressing TRMPL1 were produced by Sygnature Discovery. Whole cell patch-clamp experiments were carried out at room temperature using multi-hole chips on the SynchroPatch 384i automated electrophysiology platform. Currents were elicited by using repeated ramps, steadily increasing from -140 mV to + 100 mV over 190 ms, from a holding potential of 0 mV. Data analysis was performed using Data Control 384 V2.3 (Nanion) and GraphPad Prism V10.1.
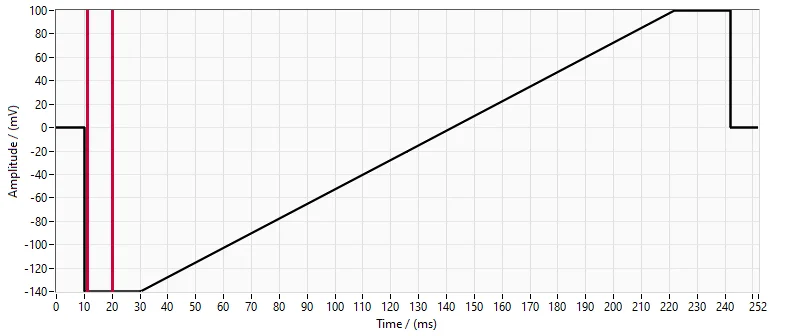
Figure 1. TRPML1 Voltage protocol.
TRPML1 currents were elicited by using repeated ramps, steadily increasing from -100 mV to +100 mV over 190 ms, from a holding potential of 0 mV.
To validate the TRPML1 electrophysiology assay, reference agonist ML SA5 was assessed at a range of concentrations using the SyncroPatch384 automated electrophysiology platform. Figure 2A highlights the success rate of the assay, with > 85% of cells successfully completing the experiment and passing strict QC criteria. The superimposed current traces and corresponding time courses shown in Figures 2B and 2C show modulation of TRPML1 activity in the presence of increasing concentrations of ML SA5 (0.01-10 µM). The EC50 of ML SA5 was 0.5 µM which is in line with literature.
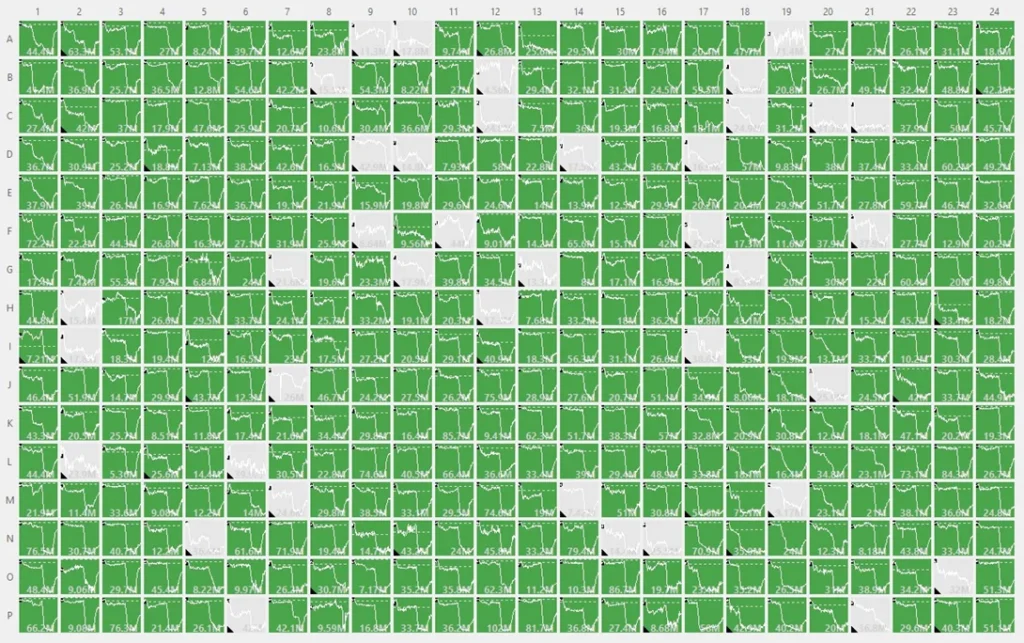
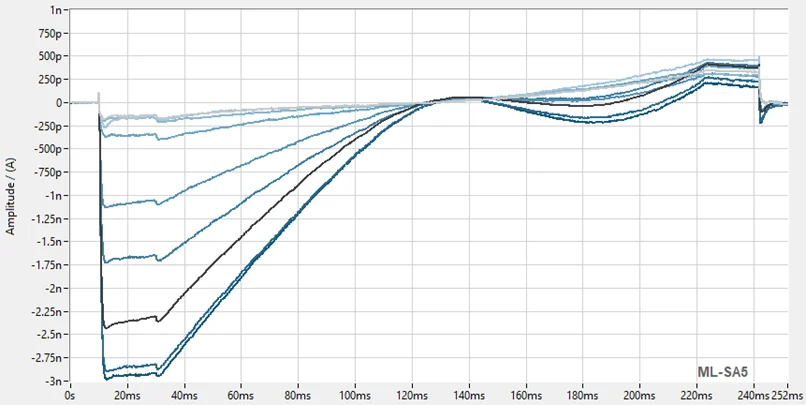
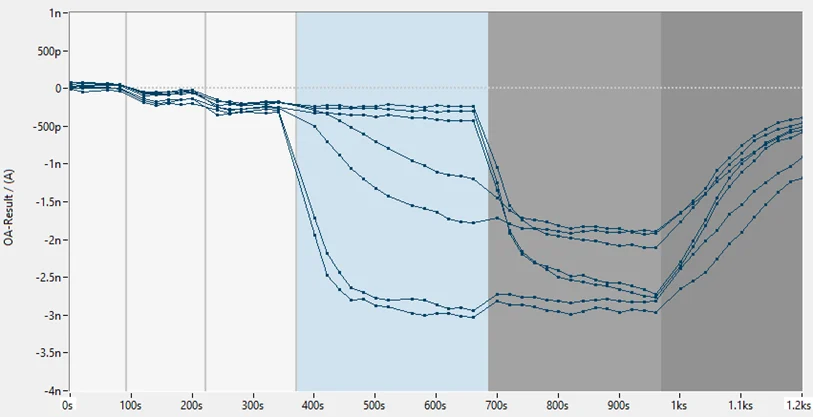
Figure 2. TRPML1 high-throughput electrophysiology.
(A) Screenshot from DataControl384 V2.3 (Nanion) showing the high percentage of cells successfully completing the experiment and passing the QC criteria. On average >85% of cells provide usable data. (B) The superimposed current trace showing effect of increasing concentrations of ML SA5. (C) Corresponding time course for the experiment showing activation with increasing concentrations of ML SA5, followed by application of saturating concentration of ML SA5 and then subsequent block by GW 405833.
Sygnature Discovery’s TRPML1 assays have undergone extensive characterization and can be conducted in agonist, antagonist, or dual mode, providing a comprehensive understanding of compound effect and potency. Each assay meets the highest standard of quality control by integrating standard reference compounds, generating robust and reliable data.

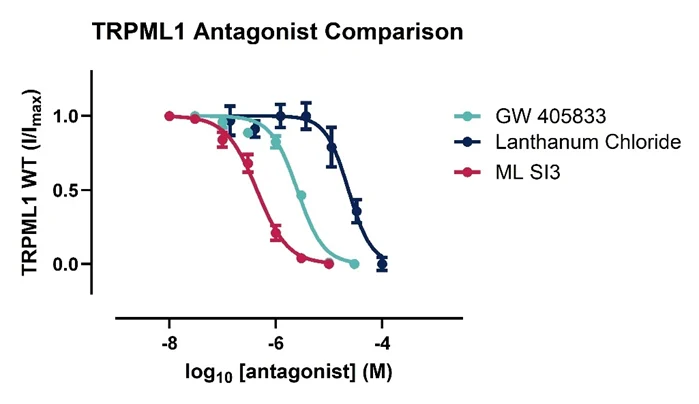
Figure 3. TRPML1 pharmacology.
Concentration response curves comparing two reference agonists (A), ML SA1 and ML SA5 and three reference antagonists (B), GW 405833, Lanthanum Chloride and ML SI3 against the TRPML1 channel. Data is generated using the automated electrophysiology platform.
Fluorescence-based high-throughput screening is the most commonly used route for ion channel hit identification. Sygnature Discovery’s TRPML1 high-throughput screening assay displays excellent correlation with downstream automated electrophysiology assays, ensuring seamless transition from hit identification to lead optimization.


|
Reference Compound
|
Platform
|
EC/IC50 (µM)
|
|---|---|---|
|
ML SA1 |
Fluorescence |
4.8 |
|
|
Electrophysiology |
5.6 |
|
ML SA5 |
Fluorescence |
0.6 |
|
|
Electrophysiology |
0.6 |
|
GW405833 |
Fluorescence |
1.3 |
|
|
Electrophysiology |
1.9 |
Figure 4. Platform correlation.
Concentration response curves for reference compounds (A) ML SA1, (B) ML SA5, and (C) GW 405833 generated using fluorescence and automated electrophysiology platforms displaying excellent cross-platform correlation.


Peak Proteins, NuChem Sciences, and SB Drug Discovery have now fully integrated with Sygnature Discovery.
